Fibonacci, PRZ, and Market Geometry
Fibonacci analysis is a way to measure proportional relationships in price movement. It helps traders study retracements, extensions, projections, swing structure, and potential reaction zones. But Fibonacci is not magic, and it should never…
Fibonacci analysis is a way to measure proportional relationships in price movement. It helps traders study retracements, extensions, projections, swing structure, and potential reaction zones. But Fibonacci is not magic, and it should never be used as a standalone signal.
This course teaches students how to use Fibonacci tools professionally. The focus is not on blindly placing levels on a chart. The focus is on understanding market geometry: how price moves in legs, how pullbacks form, how swing highs and swing lows create measurable structure, and how confluence can create areas of interest.
Students begin with Fibonacci basics, learning how to choose meaningful swing points and avoid forced measurements. A Fibonacci level only becomes useful when the swing being measured is clear and relevant. Poor swing selection leads to confusing levels and weak analysis.
The course then introduces the Potential Reversal Zone, or PRZ. A PRZ is an area where multiple technical measurements align. It may include Fibonacci retracement, extension, projection, support/resistance, supply/demand, or trend structure. The word “potential” is important: a PRZ is not a guaranteed reversal area. It is a zone where the trader watches for confirmation.
Students also learn about high-quality PRZ zones, sometimes called golden PRZ areas, where meaningful confluence appears in a clean market context. The course teaches students how to separate real confluence from forced confluence. More lines on the chart do not automatically mean better analysis.
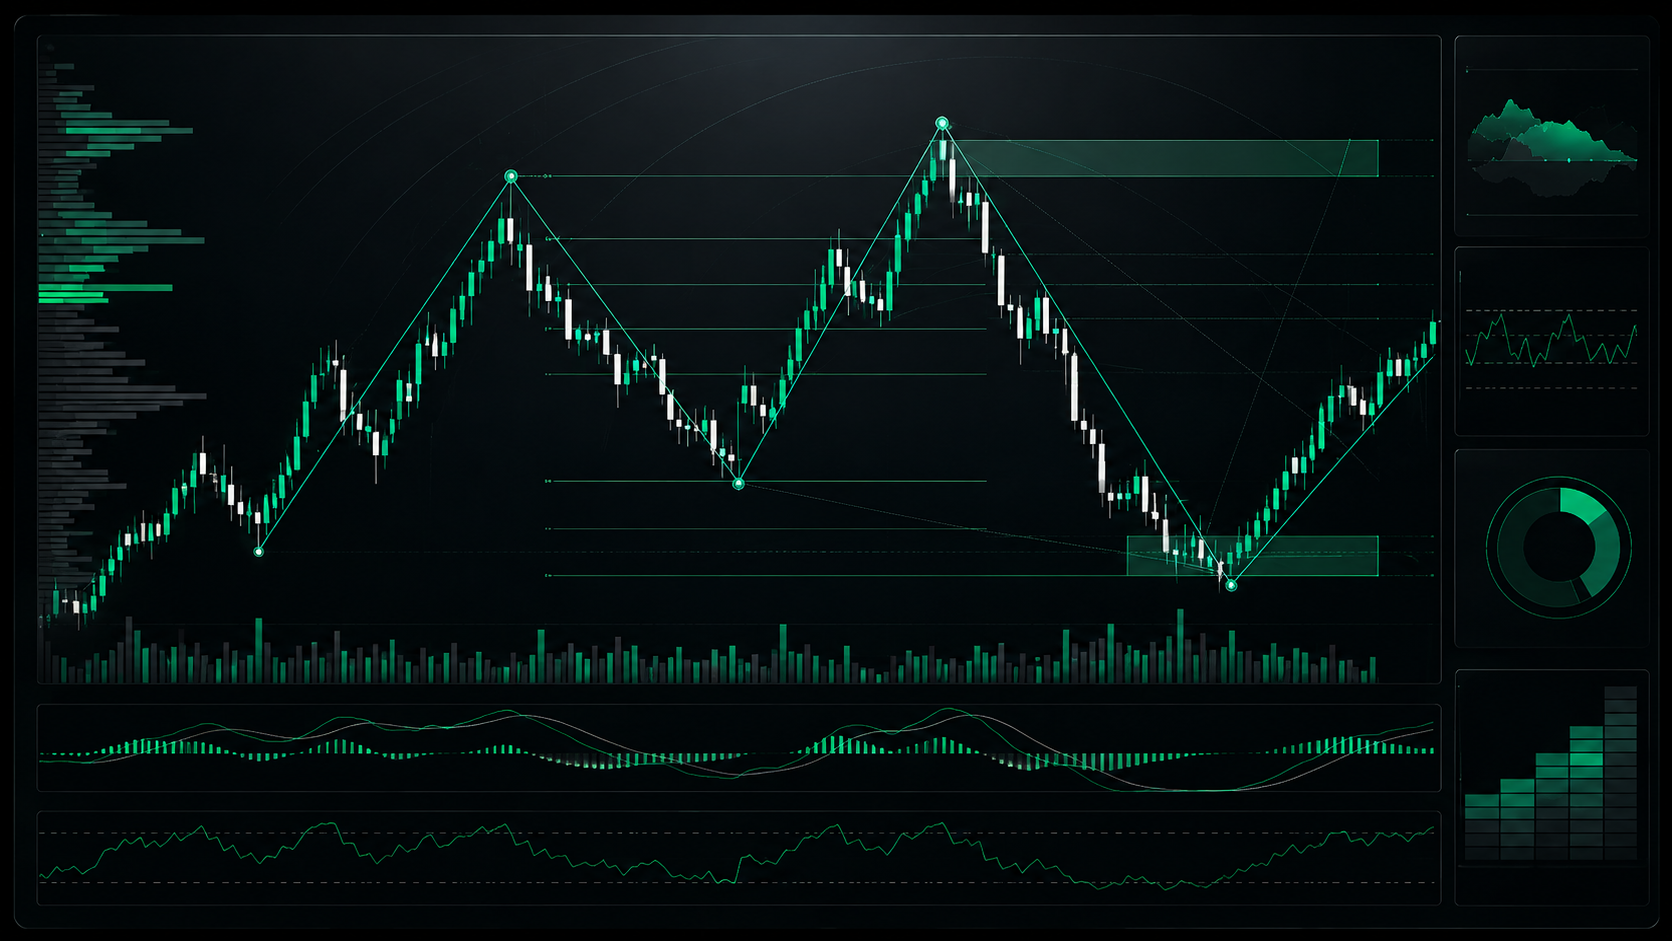
The final part of the course introduces Fibonacci zigzag and market geometry. Students learn how to connect important swing points, measure market rhythm, and avoid over-measuring every small movement.
What students will learn
- How Fibonacci retracement and projection tools work
- How to choose clean swing highs and lows
- What a PRZ is and how it forms
- How to judge PRZ quality using confluence
- How to avoid forced Fibonacci analysis
- How zigzag structure helps reveal market geometry
- How to use Fibonacci as a planning tool, not a prediction tool
Risk note: Fibonacci levels and PRZ zones do not guarantee reversals. This course is educational only and does not provide financial advice or guaranteed outcomes.
This course should feel precise, mathematical, and disciplined. It should not feel mystical. Fibonacci is presented as a measurement framework, not a secret formula.
The philosophy is “measurement with context.” Students learn that market geometry can support decision-making only when swing selection, confluence, and confirmation are clear. The atmosphere should be analytical and calm.
By the end of this course, students should be able to apply Fibonacci tools to clean swing structures, identify potential reversal zones, distinguish real confluence from forced confluence, and use Fibonacci geometry to support scenario planning and risk placement.
Course Lessons
Learn Fibonacci retracement and projection as market measurement tools, not automatic reversal signals.
Learn how a Potential Reversal Zone forms when Fibonacci levels and market structure align.
Refine Fibonacci analysis by identifying high-quality PRZ zones with real confluence and clean market context.
Learn how swing highs, swing lows, and zigzag structure help measure market rhythm and geometry.