
What is the “bigger” profit?
At first, the question looks simple. A trader who makes 30% on a $10,000 account earns $3,000. A large institution that makes 1% on $10 billion earns $100 million. The small trader has the larger percentage. The institution has the larger dollar profit. Both statements are true, but neither fully answers the deeper question.
In professional capital management, profit has at least three dimensions:
- Dollar profit: the absolute amount of money made.
- Percentage return: profit relative to capital deployed.
- Capital efficiency: return generated per unit of risk, liquidity usage, market impact, and operational complexity.
The most technical answer is this: the “bigger” profit depends on the denominator. For a corporation, asset manager, or fund sponsor, dollar profit may matter most. For a trader, allocator, or strategy researcher, percentage return and risk-adjusted return matter more. For a professional capital-management framework, capital efficiency matters most because it connects return to capacity, liquidity, risk, and repeatability.
1. Profit Amount vs. Profit Percentage
Dollar profit is simple:
Dollar Profit = Capital × Return Percentage
A $100,000 account earning 20% produces $20,000. A $10 billion portfolio earning 1% produces $100 million. In dollar terms, the institution wins. In percentage terms, the smaller account wins.
But percentage return is not only a bragging number. It measures how efficiently capital was used. If two managers take comparable risk, the one who generates higher percentage return is using capital more efficiently. If one manager takes 10 times the risk, then the comparison is incomplete. That is why professional analysis uses risk-adjusted metrics such as Sharpe ratio, Sortino ratio, maximum drawdown, volatility, beta exposure, margin usage, and tail-risk exposure.
The deeper equation is not:
Who made more dollars?
It is:
How much return was generated per unit of capital, risk, liquidity, and operational constraint?
2. Why AUM Directly Changes Return Potential
Assets under management are not passive. AUM changes the strategy. As capital grows, the manager can no longer trade the same opportunity set in the same way. A $100,000 account can enter and exit small opportunities without being noticed. A $10 billion fund cannot. A $11.6 trillion asset manager is not trading; it is allocating across entire markets. BlackRock reported approximately $11.6 trillion in assets under management at the end of 2024. BlackRock
The relationship can be written as:
Net Return(AUM) =
Available Alpha(AUM)
- Market Impact(AUM)
- Liquidity Cost(AUM)
- Operational Drag(AUM)
- Hedging Cost(AUM)
- Fee / Infrastructure Drag
The key term is Available Alpha(AUM). The best ideas are limited. Small capital can concentrate in the highest-quality opportunities. Larger capital must either size up until it moves the market, diversify into weaker opportunities, or accept lower expected return.
This is not just theory. Chen, Hong, Huang, and Kubik documented that mutual fund returns decline with lagged fund size and found the effect most pronounced among funds investing in small and illiquid stocks, suggesting liquidity-related diseconomies of scale. American Economic Review / RePEc
Berk and Green’s rational-market model also formalizes decreasing returns to scale in active management: skilled managers attract flows until excess returns are competed away by capital size. Journal of Political Economy / RePEc
Perold and Salomon described diseconomies of scale in active management as stemming from the increased costs associated with larger transactions. CFA Institute Research Foundation
3. The Capacity Constraint: Why Large Capital Cannot Trade Like Small Capital
Every active strategy has a capacity. Capacity is the amount of capital that can be deployed before expected returns degrade materially. Capacity is determined by liquidity, spread, volatility, crowding, execution time, market impact, and the number of high-quality opportunities available.
Market impact is one of the most important capacity constraints. The empirical square-root law of market impact states that the average impact of a large metaorder tends to scale approximately with the square root of order size relative to market volume. Recent market microstructure literature describes the square-root relation as a robust empirical regularity across instruments and markets. arXiv
A simplified form is:
Impact ≈ Y × σ × √(Q / V)
Where:
- Q = order size
- V = daily traded volume
- σ = daily volatility
- Y = impact coefficient
This explains why small capital can trade certain setups with almost no market footprint, while large capital destroys the edge by entering the trade. The opportunity itself changes when the order becomes too large.
Figure 1 — AUM Capacity and Option Premium Benchmark Evidence
The following figure contains two panels. The left panel models estimated market impact when deploying 1% of different AUM sizes into a hypothetical $1 billion average-daily-volume opportunity using the empirical square-root impact framework. The right panel uses historical Cboe PutWrite benchmark data to compare the Cboe S&P 500 PutWrite Index with the S&P 500 on compound return, volatility, and maximum drawdown.
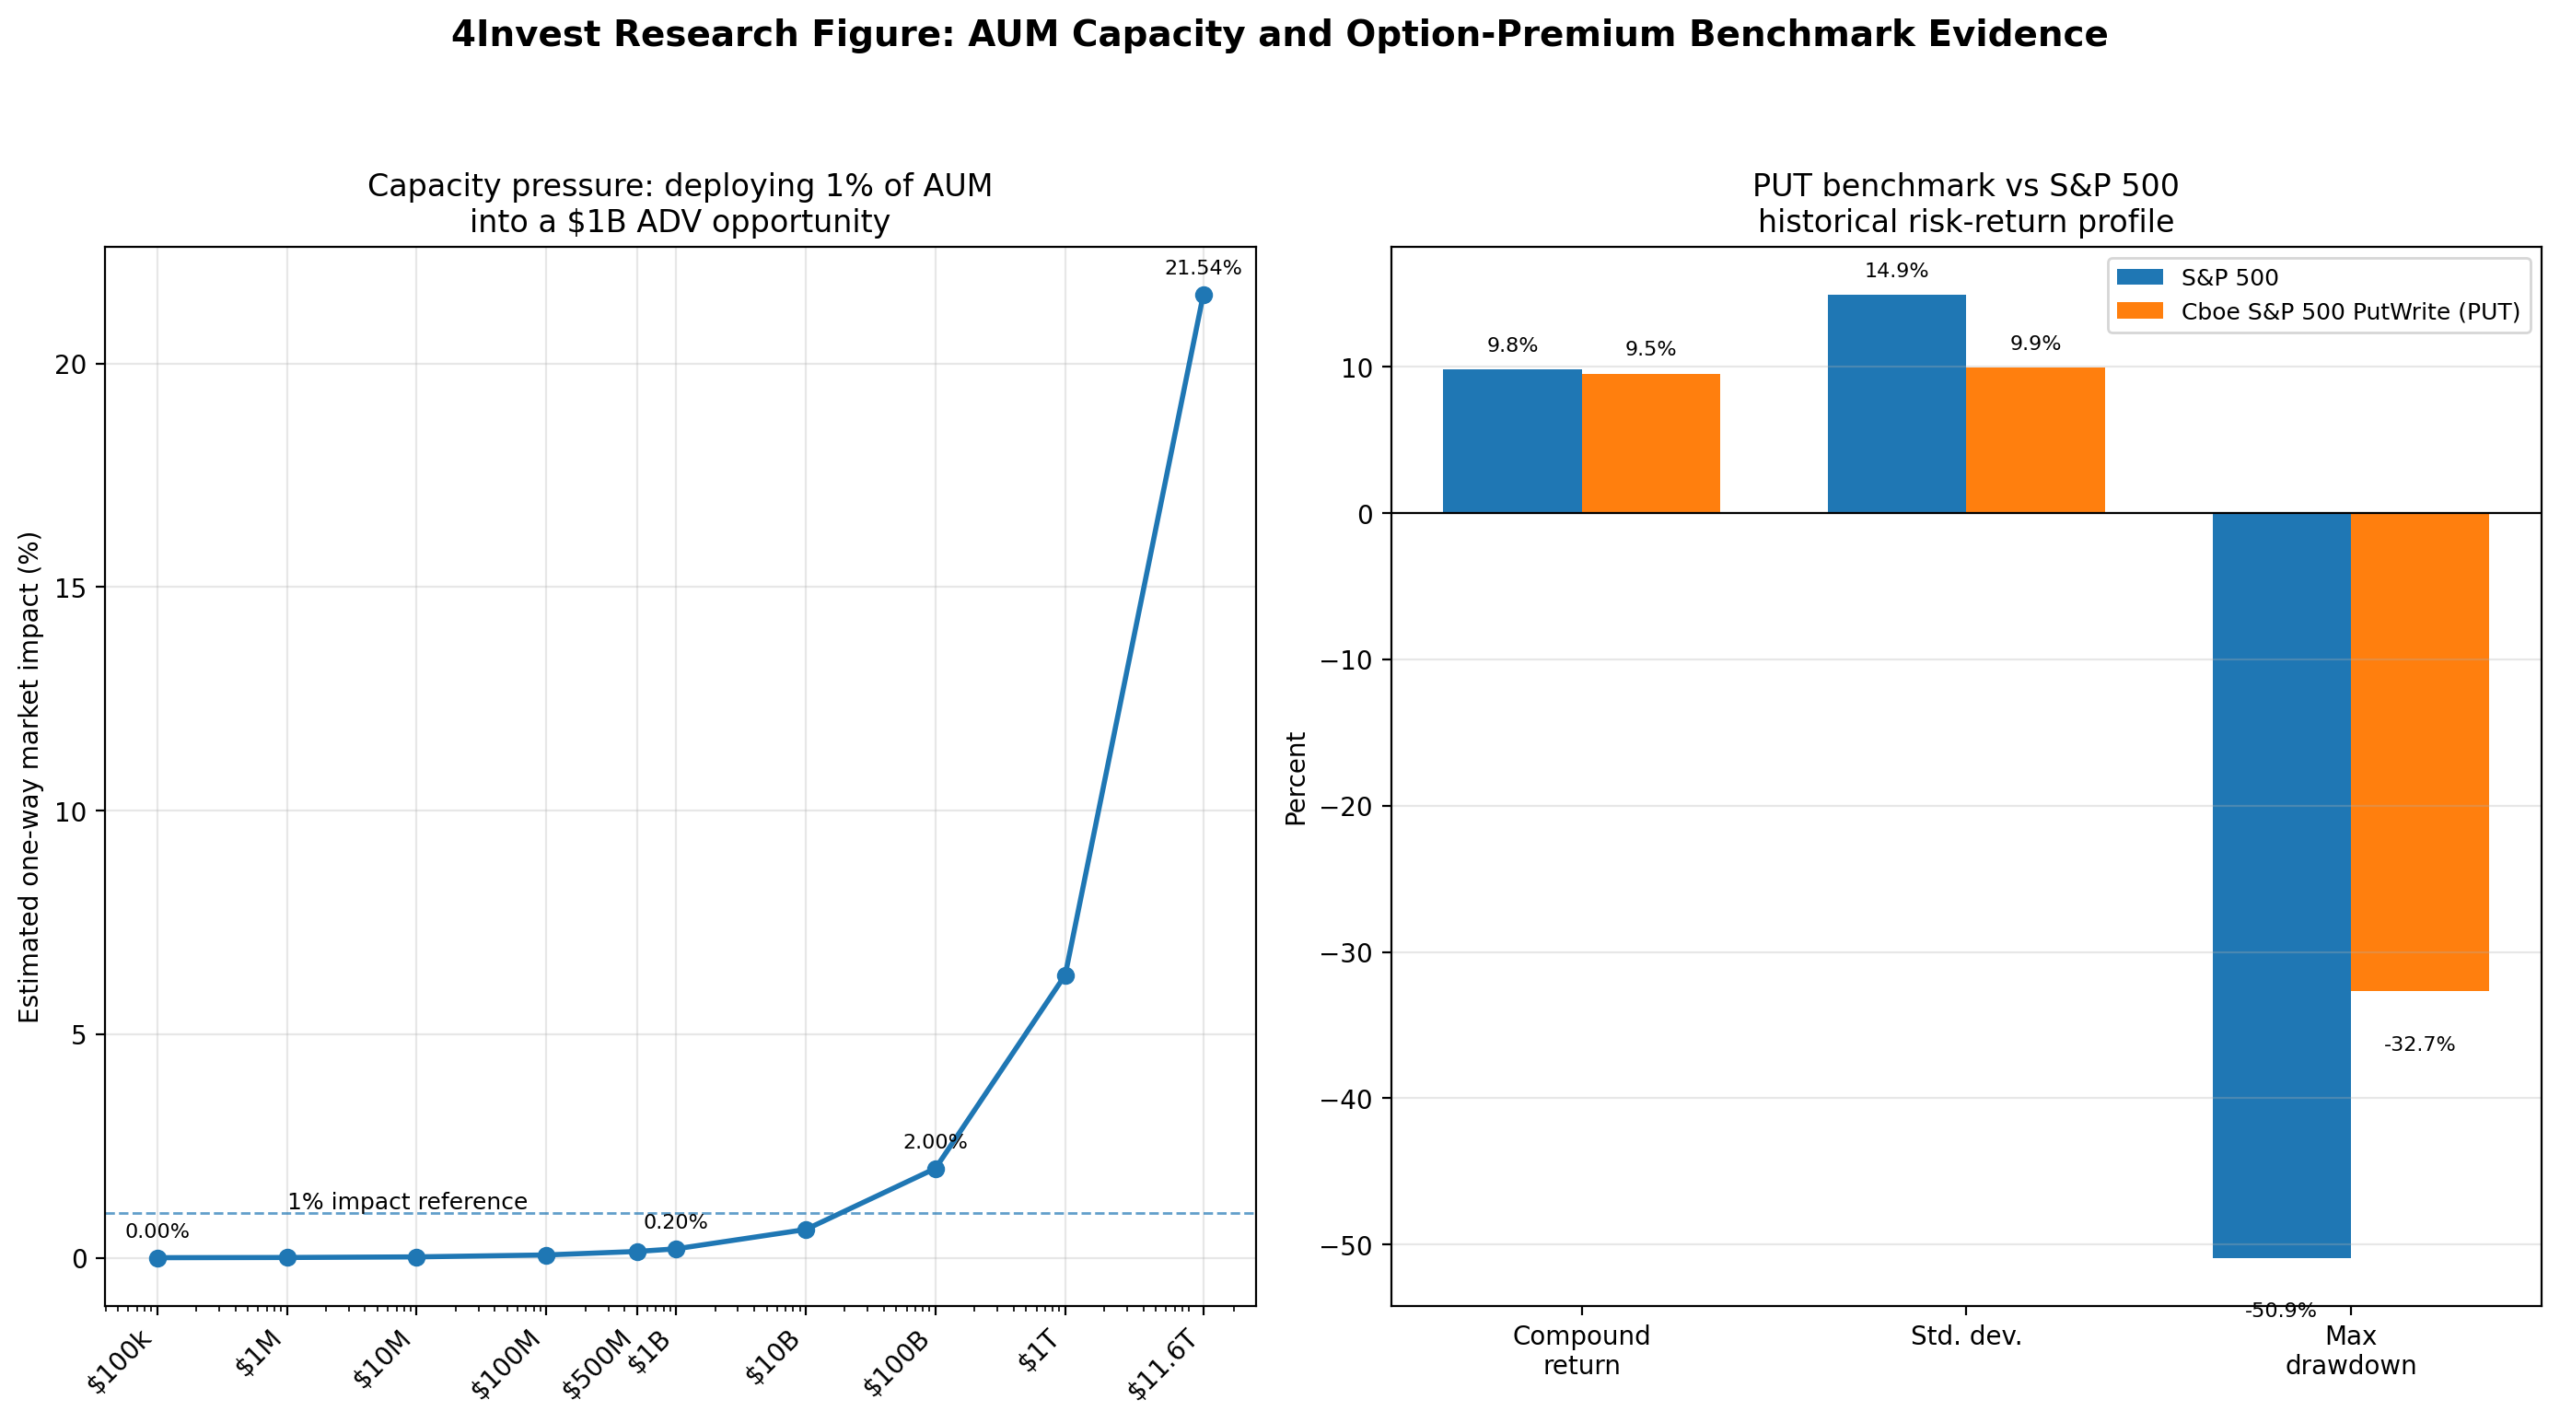
The chart should be interpreted carefully. The left panel is a capacity model based on empirical market-impact literature, not a prediction of any specific trade. The right panel uses published historical PutWrite benchmark figures showing that the Cboe S&P 500 PutWrite Index had a comparable compound return to the S&P 500 but lower volatility and a less severe drawdown over the studied period. SSRN / Cboe PutWrite research
4. Evidence From Hedge Funds: Smaller Can Be More Nimble
The same capacity problem appears in hedge funds. Teo documented a negative and convex relationship between hedge fund size and future risk-adjusted returns, finding that small hedge funds outperformed large hedge funds by 3.65% per year after adjusting for risk. Singapore Management University
Gao, Haight, and Yin also found that smaller hedge funds significantly outperformed larger ones through much of the hedge fund performance life cycle. Loyola Marymount University
The Cass Business School / Gatemore study similarly concluded that smaller hedge funds tended to outperform larger hedge funds, with outperformance especially pronounced during market distress. Bayes Business School
The interpretation is not that small is always better. Small funds may have higher operational risk, key-person risk, weaker infrastructure, and less institutional access. But in capacity-constrained strategies, small size can be an advantage because it allows concentration, speed, and flexibility.
5. The AUM Demography of Return Potential
A simplified capital-size map looks like this:
| AUM Range | Typical Advantage | Typical Constraint | Return Profile |
|---|---|---|---|
| $10k–$250k | Extreme flexibility; almost no market impact | Limited diversification; emotional risk; account fragility | High percentage possible, unstable if risk is uncontrolled |
| $250k–$5M | Still nimble; can trade liquid options without moving markets | Needs discipline, risk systems, and strict sizing | Potentially high capital efficiency |
| $5M–$100M | Professional scale; meaningful income potential | Capacity begins to matter in niche strategies | Strong if opportunity set is liquid and repeatable |
| $100M–$1B | Institutional credibility and infrastructure | Less flexibility; more diversification needed | Return percentage usually compresses |
| $1B–$10B | Access, financing, institutional relationships | Market impact and idea dilution become serious | Risk-adjusted return depends heavily on capacity |
| $10B+ | Platform scale and broad allocation power | Cannot exploit small edges without moving markets | Lower percentage return, larger dollar profit |
| $11.6T scale | System-level asset allocation and product distribution | Must allocate across entire markets | Dollar amounts dominate; percentage edge is structurally constrained |
This is the AUM paradox: the larger the capital base, the larger the possible dollar profit, but the harder it becomes to generate high percentage return without accepting market impact, liquidity stress, concentration risk, or unrealistic capacity assumptions.
6. Can a Small Trader Make a Higher Percentage Return Than BlackRock?
Yes, in percentage terms, a small trader can make a higher return than BlackRock in a given period. This does not mean the small trader is “better” in an institutional sense. It means the small trader operates under a different capacity regime.
A small trader can:
- enter and exit without moving the market;
- concentrate on a few high-quality opportunities;
- trade smaller liquidity pockets;
- adjust positions quickly;
- avoid the need to deploy billions;
- run strategies that are too small for mega-managers to matter.
A mega-manager cannot do this at enterprise scale. A $100,000 account can allocate $5,000 into a setup. A $10 trillion manager allocating the same 5% would need to deploy $500 billion. The opportunity set is no longer the same.
Therefore, the correct statement is:
Small capital can sometimes achieve higher percentage returns
because it can access capacity-limited opportunities.

Large capital can produce larger dollar profits
because the capital base is enormous.

Neither is automatically superior without adjusting for risk,
capacity, volatility, liquidity, and drawdown.
7. Why Option Premium Strategies Fit Small-to-Moderate AUM
Options premium strategies are attractive to small and moderate AUM because they can convert risk into structured cash flow without needing to predict every directional move. The most basic versions include covered calls, cash-secured puts, credit spreads, iron condors, and other premium-harvesting structures.
The U.S. listed options market is large. OCC reported 12.224 billion total options contracts in 2024, up 10.6% from 2023, with equity, ETF, and index options all contributing significant volume. OCC
However, the existence of a large options market does not mean every premium strategy has unlimited capacity. Liquidity is concentrated in certain underlyings, strikes, and expirations.
Option premium strategies can be especially suitable for smaller AUM because:
- the trader can stay in the most liquid contracts;
- position sizes can remain below market-impact thresholds;
- risk can be defined through spreads;
- collateral usage can be controlled;
- cash flow can be structured monthly or weekly;
- position adjustment is operationally easier at small size.
The key phrase is risk-managed, not risk-free.
8. The Volatility Risk Premium: Why Premium Exists
Option premium is partly compensation for volatility risk. Historically, implied volatility has often exceeded realized volatility, creating a volatility risk premium. Cboe research on put-writing strategies reported that from 1990 to 2018, average implied volatility measured by VIX was 19.3%, while average realized volatility of the S&P 500 was 15.1%, a 4.2 percentage point difference. Cboe / Bondarenko PutWrite research
That spread is one reason premium-selling strategies can work over time. But it is not a guarantee. The volatility risk premium exists because sellers are taking risk: crash risk, gap risk, gamma risk, margin risk, assignment risk, and liquidity risk.
In mathematical terms, a premium seller is often short some combination of:
- gamma: adverse acceleration when the underlying moves;
- vega: loss when implied volatility expands;
- skew: repricing of downside or upside tail risk;
- liquidity: inability to adjust at fair prices during stress;
- tail risk: rare but severe loss events.
The Options Industry Council describes the Greeks as theoretical guideposts for estimating how options react to changes in underlying price, time, volatility, and other pricing variables. Options Industry Council
A professional premium strategy must monitor these sensitivities rather than only looking at premium received.
9. Cboe PutWrite Evidence: Cash Flow With Risk Reduction, Not Risk Elimination
The Cboe S&P 500 PutWrite Index is a benchmark for a systematic cash-secured put-writing strategy. Published research reports that the PUT Index had a comparable compound return to the S&P 500 over the studied period, with lower standard deviation and a less severe maximum drawdown. SSRN / Cboe PutWrite research
Cboe-related research also notes that BXM and PUT strategies regularly sell S&P 500 index options and that premium earned varies over time, averaging around 1.7% per month in the cited exhibit. Cboe options-based fund research
This is important for 4Invest because it supports a disciplined message:
Options premium can create structured cash flow,
but the cash flow is compensation for risk.

The goal is not to eliminate risk.
The goal is to control, price, size, and manage risk.
10. Why Small AUM May Achieve More Stable Monthly Cash-Flow Efficiency
A small or moderate AUM strategy can focus on the most liquid option markets, avoid over-sizing, and use defined-risk structures. This creates the possibility of higher capital efficiency than mega-scale capital can achieve. The manager is not forced to deploy billions across less attractive opportunities.
For example, a small premium strategy can choose:
- high-liquidity underlyings only;
- defined maximum loss per trade;
- monthly or weekly premium cycles;
- delta filters;
- gamma limits near expiration;
- volatility regime filters;
- collateral limits;
- non-entry rules during event risk;
- position adjustments before tail exposure becomes excessive.
This is why small AUM can sometimes pursue a “cash-flow premium injection” model more efficiently than very large AUM. The strategy does not need to own the whole market. It needs only enough liquid opportunities to deploy the current capital base with controlled sizing.
But the word “safe” must be used carefully. The safest version is not the one that collects the largest premium. The safer version is the one that survives adverse volatility, respects drawdown limits, and avoids tail-risk concentration.
11. The Distribution Problem: Many Small Wins, Occasional Large Losses
Option premium strategies often have negatively skewed return distributions. They may generate many small gains, followed by occasional sharp losses. This is the classic short-volatility problem.
A professional framework must therefore ask:
- What is the maximum loss?
- What happens after a gap move?
- What happens if implied volatility expands after entry?
- What happens if liquidity disappears?
- What happens if several positions lose at the same time?
- How much collateral is reserved?
- When is the trade exited or adjusted?
The best premium strategy is not the one with the highest nominal premium. It is the one with the best relationship between premium received and risk retained.
12. AUM-Adjusted Profit: The More Professional Definition
A better definition of “bigger profit” is:
Bigger Professional Profit =
Return × Capital Efficiency × Risk Control × Repeatability
This definition respects the difference between small traders and mega-managers. A small trader can produce high percentage returns but may lack stability. A mega-manager can produce massive dollar returns but cannot exploit small opportunities. A professional system tries to locate the efficient middle: enough capital to matter, small enough to remain nimble, structured enough to survive volatility.
13. What 4Invest Can Say
The correct 4Invest message should be precise:
Small-to-moderate AUM can be more efficient for capacity-limited strategies.
Options premium strategies can create structured cash flow.
The strategy must be risk-managed, collateral-aware, liquidity-aware, and volatility-aware.
Risk-managed does not mean risk-free.
The incorrect message would be:
Small accounts always beat large institutions.
Options premium is safe income.
Monthly profit can be guaranteed.
Higher percentage means better manager.
The truth is more sophisticated. Percentage return measures capital productivity. Dollar profit measures economic scale. AUM determines capacity. Market impact determines how much of the opportunity survives execution. Options premium can create cash flow, but only because risk is being accepted and priced.
Conclusion
The larger profit is not always the larger dollar amount, and it is not always the larger percentage. The most meaningful profit is the one that is large relative to capital, controlled relative to risk, repeatable relative to market regimes, and scalable relative to liquidity.
Small traders and small funds can sometimes produce higher percentage returns than mega-managers because they operate below capacity limits. They can move quickly, concentrate in better opportunities, and avoid market impact. But small size is not automatically superior. Without risk control, high percentage return can simply be hidden leverage or tail risk.
For a platform like 4Invest, the strongest strategic idea is not “maximum return.” It is stable capital efficiency through risk-managed premium cash-flow strategies at an AUM size where the strategy still has capacity.
That is the real edge of small-to-moderate AUM: not magic, not guaranteed profit, but the ability to operate where large capital cannot efficiently go.
Risk note: Options involve significant risk and are not suitable for all investors. Premium received from option selling does not guarantee profit. Historical benchmark data does not guarantee future results. This article is educational and does not represent financial advice, trade signals, or a promise of future performance.
Research Sources and References
This article is based on published research, institutional market data, and options-market education sources. The following references support the discussion around AUM capacity, fund-size diseconomies, market impact, options-market volume, volatility premium, and put-writing benchmark evidence.
Options Industry Council — Understanding Options Greeks
BlackRock — Fourth Quarter 2024 Results and AUM Report
Chen, Hong, Huang, and Kubik — Does Fund Size Erode Mutual Fund Performance?
Berk and Green — Mutual Fund Flows and Performance in Rational Markets
Perold and Salomon — The Right Amount of Assets Under Management
Market Microstructure Research — Square-Root Law of Market Impact
Teo — The Capacity of the Hedge Fund Industry and Fund Size Effects
Gao, Haight, and Yin — Size, Age, and the Performance Life Cycle of Hedge Funds
Cass Business School / Gatemore — Hedge Fund Size and Performance Study
OCC — Annual 2024 and December 2024 Listed Options Volume Report
Cboe / Bondarenko — Performance Analysis of PutWrite Strategy
SSRN / Cboe PutWrite Research — PutWrite Index Historical Performance
Cboe — Performance Analysis of Options-Based Equity Mutual Funds, CEFs, and ETFs