Indicators and Timing Tools: MA, RSI, MACD, Bollinger Bands, and Ichimoku
Indicators are often misunderstood. Beginners may treat them as automatic buy or sell systems, while professionals use them as measurement and confirmation tools. This course teaches students how to use indicators with context, discipline,…
Indicators are often misunderstood. Beginners may treat them as automatic buy or sell systems, while professionals use them as measurement and confirmation tools. This course teaches students how to use indicators with context, discipline, and risk awareness.
The course begins with an indicator framework. Students learn that every indicator has a purpose and a limitation. Some indicators measure trend. Some measure momentum. Some measure volatility. Some help with timing. None of them should replace price structure or risk planning.
Students then study Bollinger Bands as a volatility tool. They learn how band expansion and contraction can reveal changes in market energy. They also learn why touching the upper or lower band is not automatically a trade signal.
Moving averages are introduced as trend filters and dynamic support/resistance tools. Students learn how moving average slope, alignment, and position relative to price can help identify trend context. They also learn why moving averages often fail in sideways markets.
The course then moves into momentum tools. RSI is used to study momentum, overextension, divergence, and possible exhaustion. MACD is used to study momentum shifts, trend rhythm, histogram expansion, and signal-line behavior. Students are taught to interpret these tools with structure rather than using them mechanically.
Ichimoku is introduced as a complete framework for trend, equilibrium, cloud structure, and timing. Students learn how to read price in relation to the cloud and how timing analysis can improve preparation and patience.
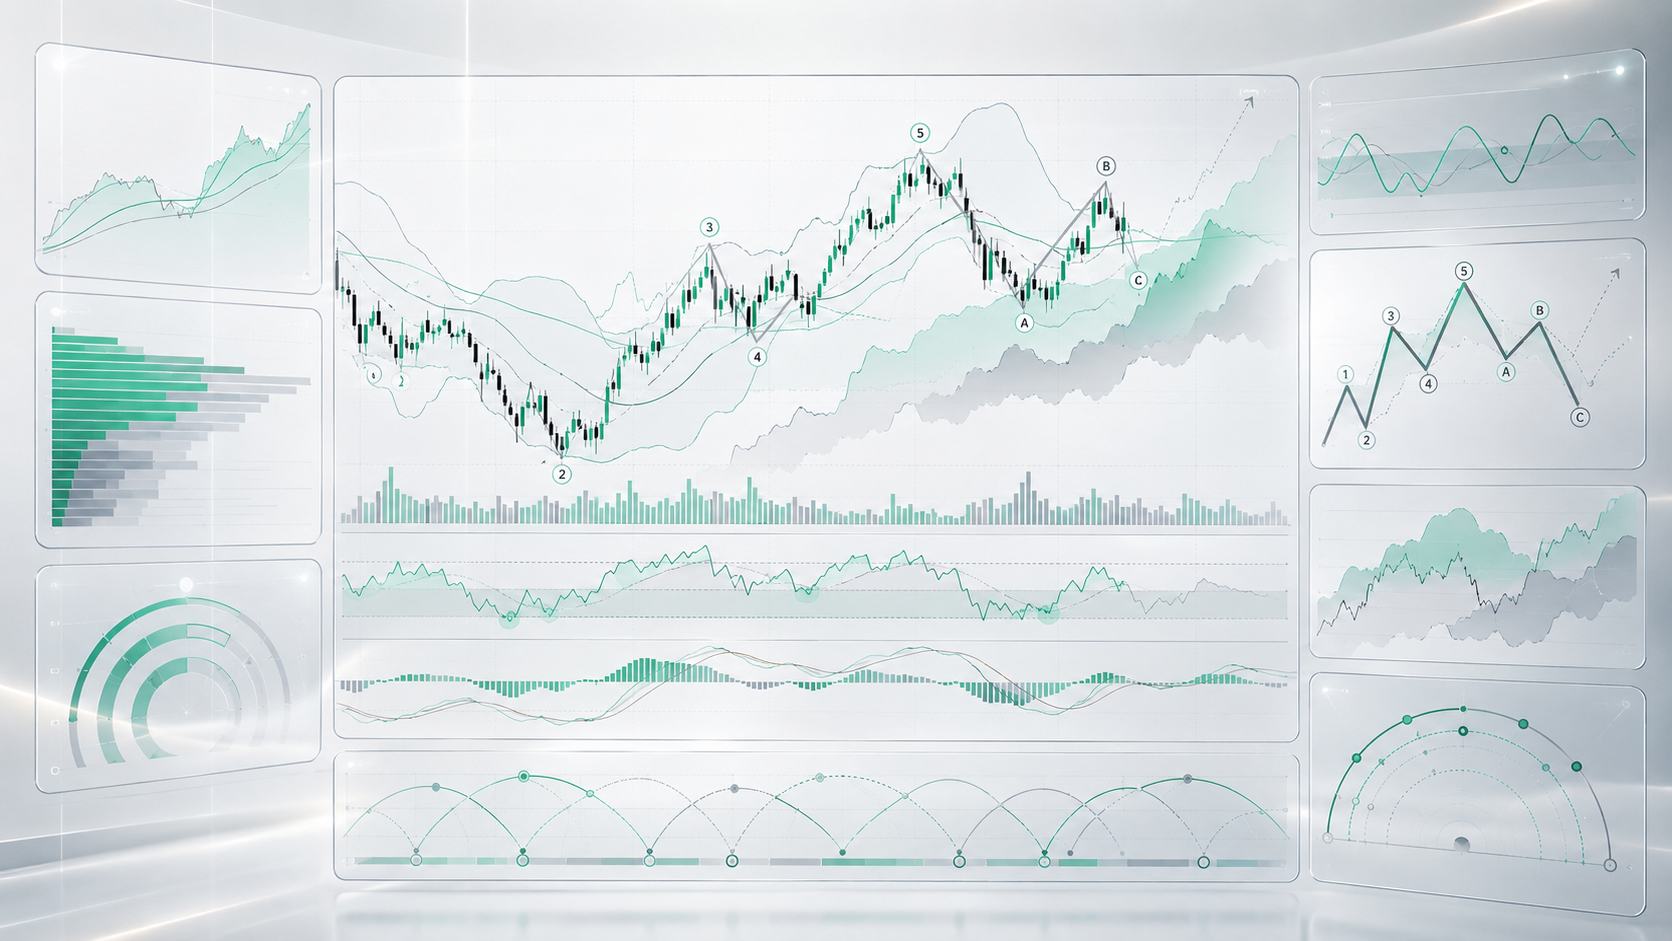
The course ends with Elliott Waves as an introduction to impulse, correction, market rhythm, and crowd-behavior structure. Students learn both the value and subjectivity of wave analysis.
What students will learn
- How to use indicators as confirmation tools
- How Bollinger Bands show volatility expansion and compression
- How moving averages help identify trend context
- How RSI measures momentum and divergence
- How MACD shows momentum shifts and confirmation
- How Ichimoku combines trend, equilibrium, and timing
- How Elliott Waves introduce impulse and corrective structure
Risk note: Indicators can support analysis, but they do not predict the future or guarantee profitable trades. This course is educational only.
This course should feel like an analytical instrument panel. The atmosphere is technical, controlled, and disciplined. Indicators are presented as measurement tools, not as magic signals.
The philosophy is “confirmation, not dependency.” Students learn how indicators can support a setup, warn against it, or reveal market condition, but they must never replace structure, context, and risk planning.
By the end of this course, students should be able to use moving averages, Bollinger Bands, RSI, MACD, Ichimoku, and Elliott Wave concepts with context. They should understand when indicators are useful, when they are late, when they conflict, and when they should be ignored.
Course Lessons
Learn how to use indicators professionally as confirmation and measurement tools, not as automatic buy/sell signals.
Understand Bollinger Bands as a volatility tool for reading expansion, compression, overextension, and market context.
Learn how moving averages help identify trend direction, dynamic support/resistance, trend strength, and market rhythm.
Understand MACD as a trend and momentum confirmation tool, including crossovers, histogram expansion, and momentum shifts.
Learn the foundation of Ichimoku as a complete framework for trend, equilibrium, support/resistance, and market context.
Study Ichimoku timing logic, future cloud projection, rhythm, and how time analysis supports better trade preparation.
Understand Elliott Waves as a way to study impulse, correction, rhythm, crowd behavior, and market phases.